Dynamic Parameters do not Predict Fluid Responsiveness in Ventilated Patients with Severe Sepsis or Septic Shock-Juniper Publishers
Juniper Publishers-Journal of Anesthesia
Abstract
The dynamic parameters, stroke volume variation (SVV)
and pulse pressure variation (PPV), are used to guide fluid
resuscitation in ventilated patients. We investigated whether SVV, PPV
and pleth variability index (PVI), an automatic measurement of the
plethysmographic waveform amplitude changes, can be used to predict
fluid responsiveness in ventilated patients with severe sepsis or septic
shock. We measured cardiac index, (CI, transpulmonary thermodilution
PiCCO2) SVV, PPV, global end-diastolic index (GEDI), central venous
(CVP), arterial blood pressure and PVI (Masimo Radical 7) before and
after infusion of 500ml Gelofusine® over 30min in 31 deeply sedated
ventilated patients (tidal volume 8ml/kg) with severe sepsis and septic
shock. We obtained one full set of measurements in 30 patients. 10
patients increased CI by at least 15% ("responders”), 20 patients were
"non-responders”. Baseline haemodynamic variables were not significantly
different between both groups. The area under the receiver operating
curves (mean, SE) were 0.68 (0.11) for SVV, 0.66 (0.12) for PPV, 0.59
(0.12) for PVI, 0.55 (0.12) for GEDI and 0.75 (0.09) for CVP We
concluded that none of the investigated dynamic parameters could
reliably predict fluid responsiveness in ventilated patients with severe
sepsis and septic shock in our study.
Introduction
Shock in sepsis results from vasodilatation and a
reduction of effective intravascular volume. Its treatment, among
others, includes optimal fluid resuscitation. Both over and under
resuscitation can worsen outcome in these patients [1].
Routine clinical examination and static indicators of cardiac preload
such as central venous pressure (CVP), pulmonary capillary wedge
pressure (PCWP), or left ventricular (LV) end diastolic area, are poor
predictors of fluid responsiveness [1,2].
Recent studies have shown that respiratory variations in the dynamic
indicators of LV stroke volume (SV), namely pulse pressure variation
(PPV) and SV variation (SVV) are more reliable predictors of fluid
responsiveness in ventilated septic patients [3-5].
Respiratory changes in the amplitude of the plethysmographic pulse wave
(ΔPOP) have been shown to be as accurate as PPV in predicting fluid
responsiveness in ventilated septic patients [5].
Pleth variability index (PVI), an automatic and continuous monitor of
ΔPOP, has been demonstrated to predict fluid responsiveness in
ventilated patients undergoing general anaesthesia [6], and in critically ill ventilated patients with circulatory insufficiency [4].
However, it is unclear whether PVI specifically predicts fluid
responsiveness in ventilated patients with severe sepsis or septic
shock. Therefore, we conducted a prospective, non-randomised, nonblinded
observational study to compare the ability of multiple dynamic and
static cardiovascular parameters to predict fluid responsiveness in
mechanically ventilated patients with severe sepsis or septic shock.
Materials and Methods
The study protocol for this observational study was
approved by both national and local ethics committees and was conducted
in accordance with the Declaration of Helsinki of the World Medical
Association. A valid informed and written consent was obtained from
patients' next of kin, after detailed explanation of the protocol, prior
to enrolment into the study. Retrospective consent was obtained from
all patients who survived to discharge from intensive care and regained
mental capacity.
Patients
Thirty-one adult non-pregnant patients who required
sedation and controlled mechanical ventilation for treatment of severe
sepsis or septic shock, as defined by the International Sepsis
Definitions Conference [7],
were enrolled in the study. Patients were subjected to a fluid
challenge (500ml of Gelofusine® administered over 30min) if they showed
at least one sign of inadequate tissue perfusion (systolic blood
pressure less than 90mmHg, urine output less than 0.5mlkg- 1h-1 for more
than 2 hours, tachycardia greater than 100 beats per minute or
capillary refill greater than 2 seconds). Patients were sedated with a
continuous infusion of Protocol and Alfentanil. Infusions were titrated
to achieve a Richmond Agitation Sedation Scale of -3. Patients were
ventilated with a pressure controlled mode (BIPAP mode, EVITA 4 XL,
Draeger, Germany) with a tidal volume of 8ml/kg estimated ideal body
weight and a positive end-expiratory pressure of not more than 15cm H20.
Respiratory rate was adjusted to achieve an arterial partial pressure
of CO2 of 4.8-6kPa. The FiO2 was titrated to achieve an arterial
saturation of >92%, the ratio of inspiratory versus expiratory time
did not exceed 1:1. Exclusion criteria included any spontaneous
breathing activity, a known allergy to Gelofusine®, any cardiac rhythm
other than sinus rhythm, contraindications for a fluid challenge
(PaO2/FiO2 less than 13.3kPa, pulmonary oedema on chest X-ray), patients
unable to lie supine or peripheral vasoconstriction causing
obliteration of the plethysmographic signal.
Haemodynamic monitoring
Invasive haemodynamic monitoring was performed by
using either a 20cm 5-Fr thermistor-tipped arterial thermodilution
catheter (Pulsiocath, Pulsion Medical Systems AG, Germany) inserted into
a femoral artery or by using a 22cm 4-Fr thermistor-tipped arterial
thermodilution catheter (Pulsiocath, Pulsion Medical Systems AG,
Germany) inserted into a brachial artery. The tip of a central venous
catheter (Arrow International Inc., Reading, PA, USA) was positioned in
the superior cava vein confirmed by X-ray examination. Central venous
blood gas samples were taken pre and post fluid challenge (ABL 725,
Radiometer, Copenhagen, Denmark). The arterial catheter was connected to
an advanced haemodynamic monitor (PiCCO2®, Pulsion Medical Systems AG,
Munich, Germany). Thermodilution was performed using at least three cold
fluid boluses randomly throughout the respiratory cycle and was
repeated within five minutes prior to and five minutes post fluid
administration. The patient was positioned supine for all measurements.
Electrocardiogram, arterial blood pressure, CVP and arterial oxygen
saturation (SaO2) were continuously monitored (Spectrum Monitor,
Datascope Corporation, Montvale, NJ, USA) and all recordings were taken
at end-expiration. A pulse oximeter probe (LNCS® Adtx, Masimo Corp.,
USA) was attached to the index finger of the right hand and wrapped to
prevent outside light from interfering with the signal. This pulse
oximeter probe was connected to the Masimo Radical 7 monitor (Masimo
SET, Masimo Corp., Irvine, CA, USA) displaying perfusion index and Pleth
Variability Index (PVI).
Conduct of the study
After ensuring at least a 5-minute period of
haemodynamic stability, the first set of measurements was obtained. This
was followed by a fluid bolus of 500ml Gelofusine® infused
intravenously over 30min. The second set of measurements was obtained
5min after the fluid infusion was completed. Ventilator settings and
dosages of inotropic, vasoactive and anaesthetic drugs were held
constant throughout the measurements. At each step of the protocol, the
following variables were recorded: Heart rate (HR), systolic, diastolic
and mean arterial pressure (MAP), CVP, central venous oxygen saturation
(ScvO2), SV, SV index (SVI), CO, cardiac index (CI), global
end-diastolic index (GEDI), SpO2, PPV, SVV and PVI. All patients were
kept in a supine position during the entire period of the study. Only
one full set of data was obtained and analysed per patient.
Statistics
In accordance with previous studies [8],
we took the criteria of a 15% increase in CI in response to the fluid
challenge to differentiate responders from non-responders to fluid. The
normality of distribution of data was tested using the
Kolmogorov-Smirnov test. Parametric data are presented as mean with
standard deviation or standard error and non- parametric data as median
with inter-quartile range (IQR).
We compared non-parametric haemodynamic data before
and after volume expansion in responder and non-responder patients using
the Mann-Whitney U test. Wilcoxon signed rank tests were used to
compare the response to fluid in responders and non-responders,
respectively. Receiver operating characteristic (ROC) curves comparing
the ability of CVP, SVV, PPV, GEDI and PVI at baseline to discriminate
between responders and non-responders to volume expansion were generated
varying the discriminating threshold of each parameter. Using the
results from previously published studies [3], we conducted a priori
power calculation which showed that 31 patients were necessary to detect
differences of 0.1 between areas under the ROC curves with a 5%
two-sided type I error and 80% power. A p-value less that 0.05 was
considered as significant. All statistical analyses were performed using
IBM SPSS Statistics for Windows, Version 20.0.
Results
Thirty-one patients were recruited. One patient
declined to provide consent retrospectively. Complete sets of data were
analysed for the remaining 30 patients. Baseline characteristics, as
well as respiratory variables and vasopressor/inotropic requirements
were not statistically different between responders and non-responders (Table 1).
Ten patients increased CI by 15% or more after volume expansion and
were classified as responders. 20 patients were classified as
nonresponders. There was no statistically significant difference in any
haemodynamic variable at baseline between the two groups (Table 2). Both responders and non-responders increased CVP and decreased PPV in response to the fluid challenge (Table 3 & 4). Only responders showed a statistically significant increase in GEDI (Table 3).
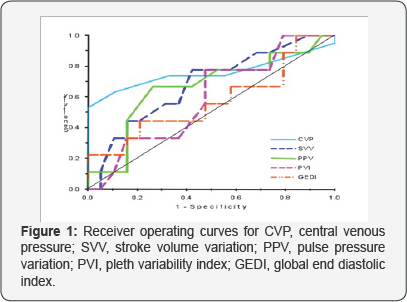
Receiver operating characteristic curves (ROC) comparing the ability of
CVP, SVV, PPV, PVI and GEDI to predict fluid responsiveness is shown in
(Figure 1).
The area under the receiver operating curves (mean, SE) were 0.68
(0.11) for SVV, 0.66 (0.12) for PPV, 0.59 (0.12) for PVI, 0.55 (0.12)
for GEDI and 0.75 (0.09) for CVP (Table 5, Figure 1).
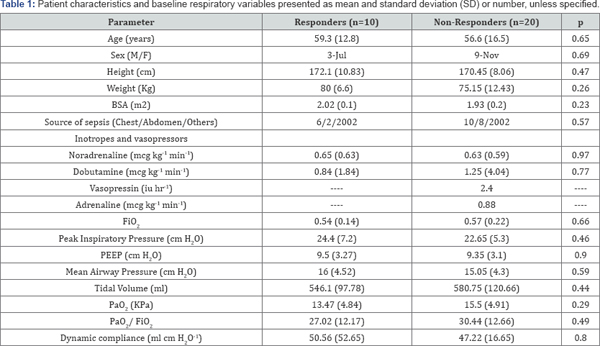
BSA: Body Surface Area; FiO2- Fraction of Inspired
Oxygen; PEEP Peak End Expiratory Pressure; PaO2 Partial Pressure of
Arterial Oxygen; PaO-2/ FiO2 Ratio of Partial Pressure of Arterial
Oxygen with Fraction of Inspired Oxygen. Vasopressin and Adrenaline was
used only in one patient each.
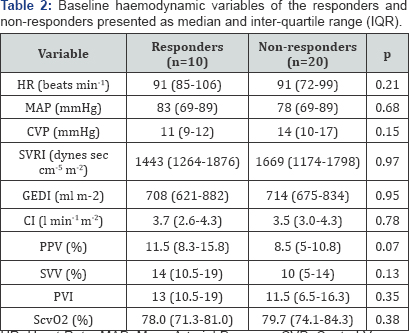
HR: Heart Rate; MAP: Mean Arterial Pressure; CVP:
Central Venous Pressure; SVRI: Systemic Vascular Resistance Index; GEDI:
Global End Diastolic Index; CI: Cardiac Index; PPV: Pulse Pressure
Variation; SVV: Stroke Volume Variation; PVI: Pleth Variability Index;
ScvO2, central venous oxygen saturation.
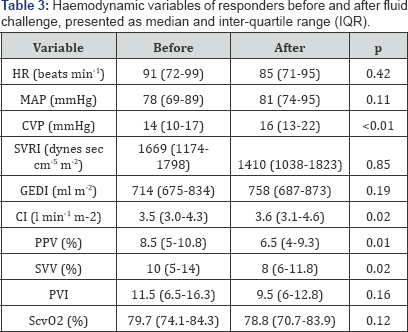
HR: Heart Rate; MAP: Mean Arterial Pressure; CVP:
Central Venous Pressure; SVRI: Systemic Vascular Resistance Index; GEDI:
Global End Diastolic Index; CI: Cardiac Index; PPV: Pulse Pressure
Variation; SVV: Stroke Volume Variation; PVI: Pleth Variability Index;
ScvO2, central venous oxygen saturation
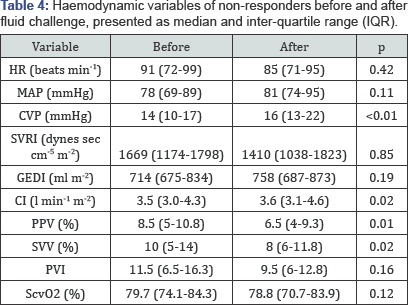
HR: Heart Rate; MAP: Mean Arterial Pressure; CVP:
Central Venous Pressure; SVRI: Systemic Vascular Resistance Index; GEDI:
Global End Diastolic Index; CI: Cardiac Index; PPV: Pulse Pressure
Variation; SVV: Stroke Volume Variation; PVI: Pleth Variability Index;
ScvO2, central venous oxygen saturation.
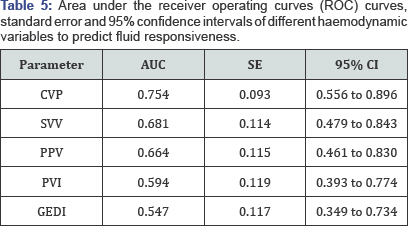
AUC: Area Under the Curve; SE: Standard Error; CI:
Confidence Interval; CVP: Central Venous Pressure; SVV: Stroke Volume
Variation; PPV: Pulse Pressure Variation; PVI: Pleth Variability Index;
GEDI: Global End Diastolic Index.
Discussion
This study aimed to compare the ability of PVI with
the more established parameters PPV, SVV, and GEDI to predict fluid
responsiveness in mechanically ventilated patients with severe sepsis or
septic shock. The main finding is that none of the above haemodynamic
parameters were able to reliably predict fluid responsiveness despite
exclusion of common known confounding factors. We observed a significant
number of false positive and false negative results considering
previously cited cut-off values for dynamic parameters in general ICU
and more specifically in ventilated septic patients [4,5,8-10].
Our study population consisted of ventilated patients with severe
sepsis and septic shock. All but three patients were receiving
vasopressor support. Known confounding variables affecting the ability
of dynamic parameters to predict fluid responsiveness were excluded: all
patients were in sinus rhythm during the study period and did not have
any arrhythmia; all were deeply sedated without any spontaneous
breathing activity and received a tidal volume of 8ml/kg estimated lean
body weight. Haemodynamic measurements were performed using the PiCCO 2
monitor which is a well validated accurate monitor measuring SV even in
rapidly changing circulatory conditions [11] and in patients with reduced cardiac function [9].
At least three cold boluses were given randomly throughout the
respiratory cycle using the same sampling period (30 seconds) to obtain
relevant haemodynamic data using transpulmonary thermodilution [12]. In line with other studies, we used a fluid bolus of 500ml Gelofusine® administered over 30min [5]. The mean CVP increased after volume expansion in both responders and non-responders by at least 2mmHg (Table 3 & 4), which has been defined previously as a proof for an adequate fluid challenge [13].
We explored the possible reasons for the unexpected finding that none
of the dynamic parameters reliably predicted fluid responsiveness in our
study. Less than 50% of our patients were responders. This is not
uncommon in critically ill patients with severe sepsis/septic shock or
after cardiac surgery [10,14,15].
It is known that septic shock is frequently associated with
biventricular dysfunction and increased pulmonary artery pressure [16].
Both RV and LV failure are well known confounders altering the
magnitude and ability of PPV and SVV to predict fluid responsiveness [17]. Impaired RV function is also a frequent problem in ARDS, a condition commonly associated with septic shock [18].
In case of RV dysfunction/failure, one might observe "false" high PPV
and SVV in non-responders as the RV after load, in contrast to preload
change, is the major determinant for high PPV and SVV [14,19]. This could be further exacerbated by increased pulmonary artery pressure, large tidal volumes and high PEEP [18,20], the latter two of which were present in our study (Table 1).
Previous studies on the ability of dynamic parameters to predict fluid
responsiveness in septic patients either did not measure pulmonary
artery pressure [5], pulmonary artery pressure was not significantly raised [3] or PEEP values were low [10].
In our study, all but three patients received vasopressors, which can
independently increase pulmonary artery pressure. Daudel and colleagues
demonstrated that, in contrast to haemorrhagic shock, in endotoxemic
shock with raised pulmonary artery pressure, PPV did not predict fluid
responsiveness [19].
A similar conclusion was reached by VanBallmoos who reported a reduced
RV ejection fraction in almost half the non-responders and in none of
the responders in patients with septic shock or post cardiac surgery [14].
In case of LV dysfunction/failure both PPV and SVV are generally decreased [3,17].
However, Mesquida et al have shown that if PPV and SVV are being used
for fluid resuscitation in heart failure conditions, the phase relation
between airway pressure and the maximal SV and hence PP needs to be
determined [17].
If the LV is afterload dependent, one could observe a simultaneous
increase in SV and hence PP when intrathoracic pressure increases and
thus PPV and SVV might be high without reflecting fluid responsiveness
particularly if the tidal volume is high and/or the chest wall is stiff
e.g. due to sepsis induced oedema. For the haemodynamic measurements
taken by the PiCCO system the phase relation between the change in
airway pressure and maximal PP and SV is unknown. PPV and SVV are
calculated over a 30sec rolling period. Reuter et al reported that SVV
measured by the PiCCO system is still a reliable marker of fluid
responsiveness in LVF with EF<35% [9].
However, in this study the AUC for SVV to predict fluid responsiveness
in patients with impaired LV function was 0.76 which was lower than the
AUC for SVV to predict fluid responsiveness in a second group of
patients with normal LV function (0.88).
Gruenewald et al reported that in animals suffering
from stunned myocardium shortly after cardiac arrest all dynamic
parameters are unreliable in predicting fluid responsiveness [21].
Wiesenack and colleagues, found no correlation between SVV measured by
the PiCCO system and prediction of fluid responsiveness in patients
undergoing elective coronary artery bypass surgery, with an ejection
fraction >50% [22].
In this study the authors speculated that arterial pulse contour-
derived estimates of SVV are potentially unreliable under positive
pressure ventilation. PPV is considered the more sensitive and specific
parameter compared to SVV in predicting fluid responsiveness as pressure
measurements are usually more accurate than SV measurements. However,
in our study neither baseline SVV nor PPV could reliable predict fluid
responsiveness. SV and PP are tightly correlated during positive
pressure ventilation [17].
The magnitude of PP for any given SV depends on central arterial
compliance. Thus, a vasopressor induced reduction in central arterial
compliance could lead to large changes in PP and hence PPV even for
small changes in SV. The majority of the patients in our study were
treated with vasopressors and it is tempting to speculate that this
might be a further explanation why some patients were unresponsive to
fluids despite high baseline PPV. Furthermore, it is conceivable that a
more pronounced inspiratory increase in PP is due to an exaggerated dUp
phenomenon in the presence of reduced LV function [8]. which might have contributed to an increase in PPV in non-responders.
As the cyclic changes in RV and LV pre- and after
load are dependent on cyclic changes in intraalveolar, intrapleural and
hence transpulmonary pressure any factor affecting one or a combination
of these would have an impact on all dynamic parameters. Increasing
tidal volume directly increases the magnitude for PPV and SVV for any
given chest and lung compliance [17].
Intraabdominal pressure affects chest wall compliance and hence
intrapleural pressure. In fact, Jacques et al showed that the cut-off
values for all dynamic parameters increase significantly if
intraabdominal pressure is increased [23].
We did not measure intra abdominal or intrapleural pressure in our
study. Respiratory system compliance was not significantly different in
both groups. However, we cannot exclude the possibility that differences
in transpulmonary pressures induced by the same tidal volumes might
have contributed to our findings. Loupec et al showed that PVI reliably
predicts fluid responsiveness in critically ill ventilated patients [4]. However, this result has not always been replicated in septic patients treated with vasopressors [10,15,24].
One possible explanation for this finding could be that the proportion
of septic shock patients was lower in Loupec's study (55%) than in the
other studies (85%, 86%) [4,10,15].
Conclusion
We conclude that the dynamic parameters PPV, SVV and
PVI may not be able to predict fluid responsiveness in all ventilated
patients with severe sepsis or septic shock even after exclusion of
already commonly known confounding factors. An assessment of RV and LV
function and measurement of intraabdominal or even transpulmonary
pressure should be taken into account before interpreting and acting on
the values measured. Passive leg raising, as a "reversible” fluid
challenge might help to prevent unnecessary and potential harmful fluid
loading provided intraabdominal pressure is not increased [25].
Acknowledgement
Hardware and software for the conduct of the study were supplied by Masimo Corp., Irvine, CA, USA.
The study was supported by a grant from the Research
Development Department, The James Cook University Hospital,
Middlesbrough, United Kingdom.
For more articles in Journal of Anesthesia
& Intensive Care Medicine please click on:
https://juniperpublishers.com/jaicm/index.php
https://juniperpublishers.com/jaicm/index.php
Comments
Post a Comment